
I’m a data engineer at Stok, working with our building performance management experts. What’s a data engineer doing at a sustainability firm?
As a data engineer, my job is to help Stok’s technical advising teams gather, clean, and analyze massive datasets, as well as automate these processes to more quickly uncover insights that streamline processes and drive real decarbonization.
For companies managing energy use and carbon emissions across real estate portfolios and single buildings, data is both an asset and a challenge. Clients come to us with a range of needs—some are focused on decarbonizing as part of a broader sustainability strategy while others seek to reduce operational costs through energy efficiency improvements. Many organizations also face increasing regulatory disclosure and performance requirements and need accurate, transparent energy and emissions tracking to remain compliant. Our role is to provide energy data analysis and modeling, environmental, social, and governance (ESG) best practices, and greenhouse gas (GHG) emissions inventories to help them navigate these challenges and make informed decisions.
Managing data and decarbonization can be complex at a single asset let alone across a vast portfolio. Messy spreadsheets with data gaps, inconsistent formats, and scattered sources often make it difficult to extract meaningful insights; however, with the right approach, even the most complex datasets can be transformed into powerful decision-making tools. Here’s a practical guide for beginners, specifically for sustainability professionals, energy managers, and building operators responsible for tracking and optimizing building performance.
WHAT MAKES ENERGY AND CARBON DATA MESSY
-
- Multiple sources, different formats. Energy data comes from a variety of sources—utility providers, building systems, and manual entries—and often in incompatible formats. This makes integration and analysis difficult. Each source “speaks a different language,” creating a fragmented and messy data landscape.
- Data gaps and quality issues. Missing values, incorrect readings, and inconsistencies make analysis difficult.
- Granular vs. portfolio-level data. Submeter interval data is powerful, but without standardization, compiling comprehensive reports and recognizing trends becomes incredibly challenging.
- Regulatory and reporting requirements. Navigating diverse reporting standards such as municipal and state-level building performance standards, each with unique data and disclosure requirements, adds another layer of complexity.
HOW WE APPROACH THESE CHALLENGES
One of my early projects at Stok involved analyzing energy data for a large commercial real estate client with a diverse portfolio of office and mixed-use properties. My goal was to standardize and automate energy data processing, perform data analysis, and provide actionable insights to support the client’s decarbonization strategy.
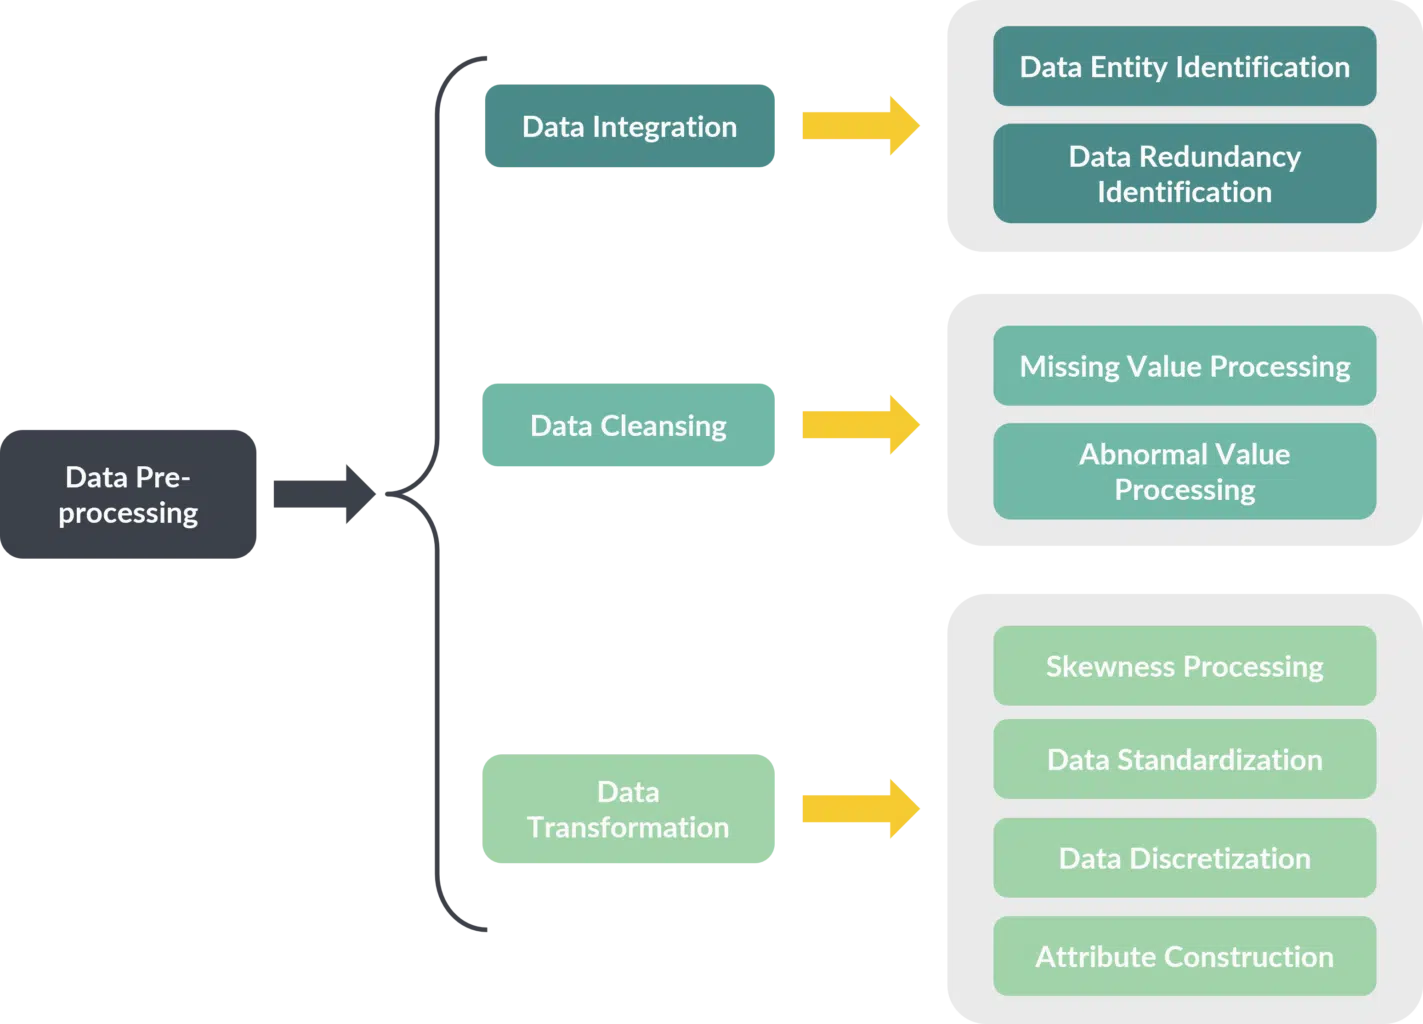
Step #1: Standardize and clean the data
The process typically starts by gathering utility bills, sub-meter readings, and manually logged data from different locations. Files could be in Excel, CSVs, or PDFs. To address this:
-
- Consolidate all data sources into a central database. Using automated scripts, we extract and structure the information from various formats.
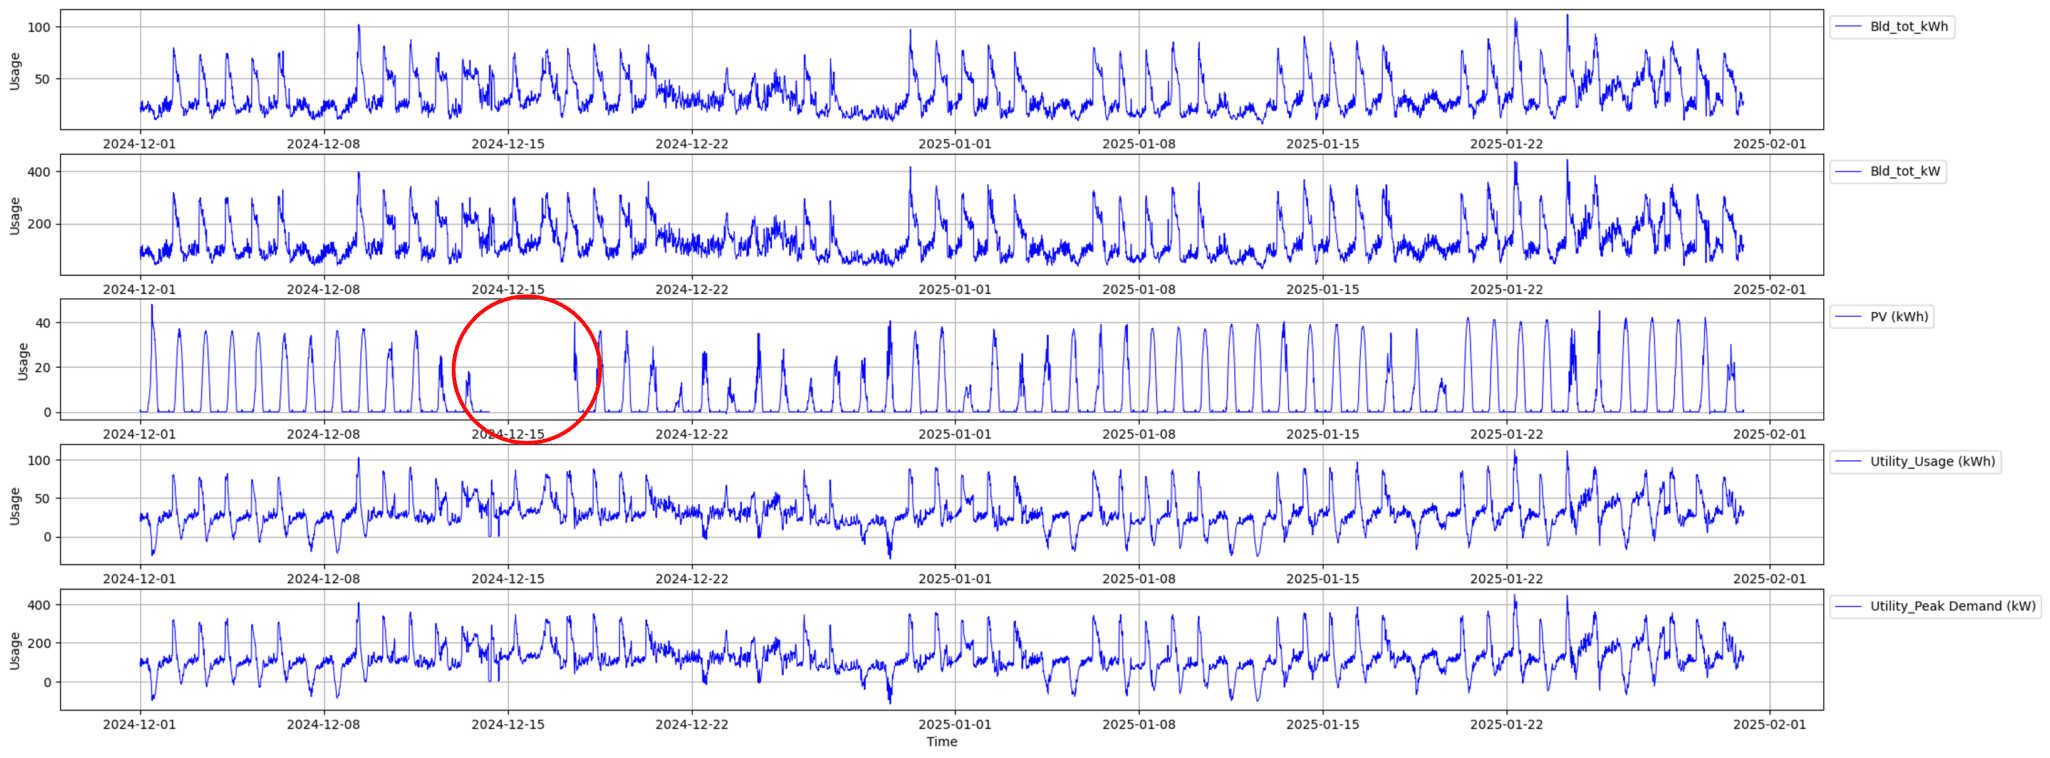
- Identify missing values and inconsistencies. A validation process flags anomalies, such as duplicate entries, missing data and implausible energy spikes.
- Convert all data into a uniform format. Normalizing timestamps, measurement units, and naming conventions creates consistency across the dataset.
Step #2: Match energy data with real-world performance
With a clean dataset in place, we compare energy consumption patterns to real-world building operations. This involves:
-
- Verifying utility bills against sub-meter data. We identify discrepancies between reported and actual usage, helping spot potential billing errors and inefficiencies.
- Detecting anomalies and unexpected trends. We review sudden spikes or drops in energy use with the client to confirm whether they reflect actual changes in operations or indicate data anomalies. For example, a spike at one property might be caused by an HVAC system running 24/7 due to a scheduling error.
- Establishing baseline performance models. We analyze historical energy data to build predictive models that define expected usage patterns. When actual consumption deviates from these patterns, the models flag potential issues—such as equipment malfunctions or operational changes—for further investigation.
Step #3: Drive building-level strategy through insights
Once the data is validated and energy patterns are well understood, we work with clients to translate these insights into action. This includes:
-
- Identifying buildings with the greatest opportunity for efficiency gains. We highlight where improvements can deliver the most impact, whether through equipment upgrades, operational changes, or behavioral adjustments.
- Developing automated dashboards for real-time tracking. These tools allow clients to monitor energy performance in real time, track progress toward goals, and quickly detect any issues.
- Providing a roadmap for decarbonization. By tying trusted energy data to owners’ sustainability goals, external regulatory requirements, and financial constraints, we deliver a step-by-step roadmap to achieve emission reduction goals.
As a result, clients gain the visibility needed to uncover potential inefficiencies and operational issues that may otherwise go unnoticed. While specific cost savings can vary, this clarity enables more informed decisions around energy use and emissions management. By transforming disorganized data into actionable insights, we empower clients to prioritize efficiency improvements, support compliance efforts, and advance their broader sustainability goals with confidence.
KEY TAKEAWAYS FOR BEGINNERS
If you’re just starting to collect, analyze, or act on energy and carbon data, here are five key actions that will drive efficiency and decarbonization at the asset level:
-
- Start with a data audit. Identify what data you have, where it comes from, and where the gaps are.
- Standardize early. Define common units, timestamps, and formats to avoid messy analysis later.
- Use automated tools where possible. Leverage APIs, scripts, or platforms to reduce manual work.
- Tie data to decision making. Don’t just collect data—use it to set benchmarks, track progress, and inform strategy.
- Expect iteration. Data quality improves over time as processes become more refined.
UP NEXT: A TWO-PART EXPLORATION
Given the complexity of this topic, we’ll be diving deeper in an upcoming Part 2 focused on portfolio-wide GHG data management—where things get even trickier. Stay tuned!
If you’re ready to start tackling your organization’s energy and carbon data now, reach out to our team.