

This year we’re diving deep into the business case for sustainability so you can invest wisely, clearly communicate impact, and bring others along on the journey.
Top takeaways:
-
- Scalable, standardized data management is a competitive advantage. CRE teams that streamline data collection, improve quality, and enable interoperability can reduce operational cost, improve assurance readiness, and make faster, more confident decisions about capital, resilience, and decarbonization investments.
- For CRE sustainability teams, successful portfolio reporting depends on understanding what your energy data represents, verifying your data is complete, and properly documenting it for consistent data quality checks.
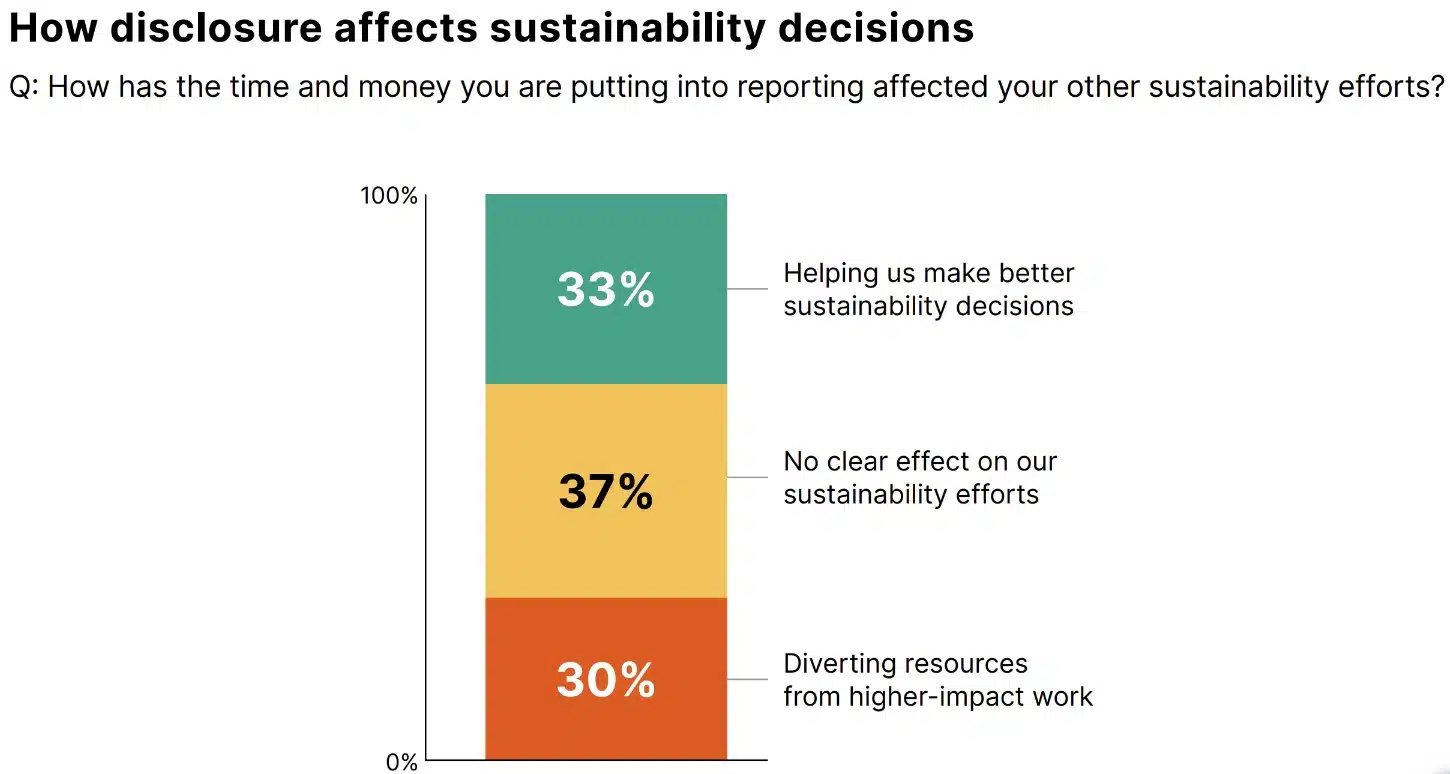
A stat in the recent Trellis State of the Sustainability Profession 2026 report caught our eye: half of companies surveyed are spending more time and money on sustainability reporting, yet 67% feel it’s had no clear effect on their sustainability efforts or is actively diverting resources from higher-impact work. This suggests that many companies’ sustainability data have yet to stretch beyond the silo of reporting to empower smarter business decisions through integration into capital planning cycles and investment strategy, which is where the real magic happens.
For CRE firms and corporate occupiers, the core of this reporting challenge lays in the data collection and data quality it’s informed by. Sustainability and asset management teams are expected to collect, standardize, validate, and report building-level energy data, among other metrics, across large, geographically dispersed portfolios while responding to growing corporate, investor, regulatory, and assurance expectations.
Strong portfolio-level data management is increasingly a competitive advantage: firms with reliable, well-structured data can make more confident decisions about capital planning, resilience, and decarbonization investments, not to mention reduce reporting rework, improve assurance readiness, and respond faster to regulatory change.
Take, for example, a North American property owner that implemented standardized collection frameworks, documented inventory management processes, and phased data improvement planning to strengthen energy and emissions visibility across its portfolio over multiple reporting cycles. The effort improved consistency across Scope 1, 2, and 3 reporting while creating a more scalable foundation for future climate planning and investor disclosures.
GOOD DATA ENABLES GOOD BUSINESS DECISIONS
Portfolio-level data accuracy directly influences investor confidence, capital planning, operational efficiency, compliance readiness, audit outcomes, and long-term asset value. However, fragmented systems, inconsistent utility access, and limited interoperability between platforms often create costly inefficiencies across reporting and operational workflows. Many teams spend too much time on data wrangling and repeated QA/QC cycles instead of getting to use timely data to inform investment and operational decisions.
Strong portfolio data management helps reduce this operational burden while improving decision-making. With more accurate data, companies can better identify underperforming assets, prioritize decarbonization investments, reduce assurance risk, and avoid costly reporting discrepancies or compliance penalties.
This also improves consistency across frameworks such as GRESB, CDP, EcoVadis, and ENERGY STAR® Portfolio Manager. Rather than recreating datasets for multiple reporting platforms, firms with well-structured portfolio data can streamline reporting processes, reduce rework, and improve confidence in disclosures shared with investors and regulators.
How can you actually do this? In our guide to asset-level energy data, we outlined five key actions to drive efficiency and decarbonization at the building level. Here we dig into the even trickier piece: how to collect, standardize, and validate energy data across your portfolio to support credible reporting and more informed capital, resilience, and decarbonization planning.
YOUR GUIDE TO PORTFOLIO-LEVEL ENERGY DATA
PORTFOLIO-LEVEL ENERGY DATA REQUIRED FOR YOUR GREENHOUSE GAS (GHG) INVENTORY
To unlock these benefits, teams first need to align on what “good” portfolio data looks like, both in structure and level of detail. Consistency and transparency at the facility level create a strong foundation for accurate aggregation and comparison across the portfolio. This initial step also reduces risk of overwork and overspend on data collection by aligning key stakeholders early.
#1: Key facility information
Consistent facility-level information enables more accurate benchmarking and performance comparison across portfolios. At a minimum, each property in your portfolio should have:
-
- Address and building name.
- Building floor area for the whole building area as applicable. Clarify whether the building floor area represents whole building, landlord-controlled areas, common areas, or vacant space, and make sure a common metric is used across the portfolio (e.g., gross floor area).
- Primary property use or type (e.g., office, retail, multifamily, etc.).
- Occupancy or vacancy rate. This information provides the context needed to interpret energy intensity and compare similar assets.
- Which energy sources are used at each facility (i.e., is the facility all electric or does it use natural gas?). This information enables data validation and informs estimation where needed.
#2: Actual energy data by source
While estimated energy data can fill gaps and support high-level reporting, actual energy data helps firms make better financial and operational decisions with less risk. Real data helps teams identify underperforming assets and prioritize upgrades with the highest ROI that could be missed with estimated datasets, enabling firms to move beyond data management as a reporting exercise to informing better capital planning.
For actual energy data, collect monthly metered energy consumption data for each source (e.g. electricity, natural gas, district steam, etc.), in consistent units of measurement (e.g., kWh, therms, or MMBtu). At the portfolio level, a common issue is unclear coverage. For clarity, document what portion of the building the data represents.
#3: Missing or estimated data
Still, data gaps are common across large portfolios, and maintaining a complete dataset, even when some values are estimated, helps teams preserve reporting consistency, identify portfolio-wide trends, and make more informed investment decisions. In these cases, document:
-
- Which energy source is being estimated (e.g., natural gas or steam).
- Note the number of missing months of data that need to be gap-filled and estimated. Apply a consistent method to estimate missing data (e.g., Building Performance Database EUIs for building type and energy source).
- Clearly document any estimated values in the final data set.
If you’re using a lot of estimated data right now, a data improvement plan can help. This plan outlines how your team will refine specific pieces of data, so the final metrics become less reliant on estimation over time, improving the quality of your portfolio-level dataset and making it more defensible and decision-ready.
#4: Renewable energy and RECs
Finally, include information on:
-
- Renewable energy generated onsite (e.g., solar PV) and whether renewable energy certificates (RECs) were retained or sold. Note: If the RECs were sold, provide both the gross energy consumption and total onsite generation at the asset, not just the net load.
- RECs purchased (e.g., volumes, vintages, and suppliers). This accurately reflects renewable contributions in both energy and emissions reporting.
- Any green tariffs and specific electricity utility providers by the amount of energy, location, and contract details needed for market-based Scope 2 calculations.
PORTFOLIO-LEVEL ENERGY DATA QUALITY CHECKS FOR YOUR GHG INVENTORY
Once data is assembled, it’s time to evaluate accuracy and completeness. These checks help flag anomalies early before they affect your final calculations. This helps teams avoid costly reporting corrections, reduce assurance and compliance risk, and make more confident decisions.
#1: Review portfolio energy use intensity (EUI)
Calculate the annual EUI for each building. If needed, extrapolate partial year data (i.e., a building opened or closed during the year) to a full year for comparison purposes.

Compare the EUI against benchmarks for the building type and region. Significant deviations often indicate a data error, missing bills, incorrect floor area reporting, or misallocated metering. Review both total EUI and EUI by source (e.g., electricity, natural gas, district steam, etc.) to identify which utility type is driving anomalies.
#2: Evaluate vacancy impacts
Understanding how occupancy affects energy performance helps sustainability and asset management teams distinguish operational changes from true performance issues, improving insight into inefficient assets and assets at risk of non-compliance with building performance standards.
A building operating at 50% occupancy should not exhibit the same EUI as a fully occupied/leased property. Make note of these cases and how they impact site EUI in case there may be an underlying data issue. If EUI remains unchanged despite major occupancy shifts, review meter boundaries and building floor area allocations for potential discrepancies.
#3: Verify building floor area
Check that the energy data coverage aligns with the building floor area. Where full coverage is unavailable (e.g., landlord-controlled loads), document the percentage of the building floor area represented and estimate the uncovered data using defensible methods to achieve complete energy coverage.
#4: Analyze trends over time
Analyze YoY trends for each property and the overall portfolio to identify:
-
- Sudden spikes or drops in consumption by energy source.
- Unexpected changes in energy mix.
- Sharp deviations that do not align with weather, operational changes, or occupancy trends.
While an annual quality check is a good start, we recommend reviewing data trends quarterly to catch issues earlier and reduce year-end reconciliation, and to review multi-year trends in addition to single year-over-year trends, which can sometimes be volatile based on changes in data collection and/or quality.
STRONG PORTFOLIO ENERGY DATA BUILDS CONFIDENCE IN REPORTING AND PLANNING
Strong portfolio energy data reduces costly reporting rework, lowers assurance risk, and enables faster, more confident decisions across compliance, capital planning, and investor reporting. When portfolio energy data is strong, everything downstream—from disclosures to decarbonization strategy—becomes clearer, faster, and more defensible.
For commercial real estate owners and operators, high quality GHG reporting starts with reliable, well-structured portfolio-level energy data, which depends on:
-
- Understanding what your energy data represents via standardized, detailed facility information.
- Verifying your data is complete with actuals and estimates as needed.
- Properly documenting it for consistent data quality checks.
In sustainability reporting, complete and high-quality data equals credibility; perhaps more importantly, it equals decision-useful information from which to build effective climate strategy. If you’re ready to start tackling your organization’s portfolio-level energy data, reach out to our team.